
Aug 11, 2-2020: All data for GOGREEN and GCLASS are now publicly available. See GOGREEN and GCLASS First Data Release and Balogh et al. (2020) for details.
The Gemini Observations of Galaxies in Rich Early ENvironments (GOGREEN) Survey is built on multi-object spectroscopy of 21 galaxy clusters in the redshift range 1<z<1.5, representing the Universe when it was only a third of its prese nt age. The targets are selected to span a wide range of masses, representing the range of building blocks from which today’s clusters were built. The sample of spectroscopically confirmed members reaches unprecedented stellar masses at this redshift, providing the first look at environmental effects on galaxy evolution at a time when galaxies were growing in a fundamentally different way from today. Our methodology takes full advantage of Hamamatsu detectors, which make Gemini’s GMOS spectrographs the best in the world for studying distant galaxy clusters.
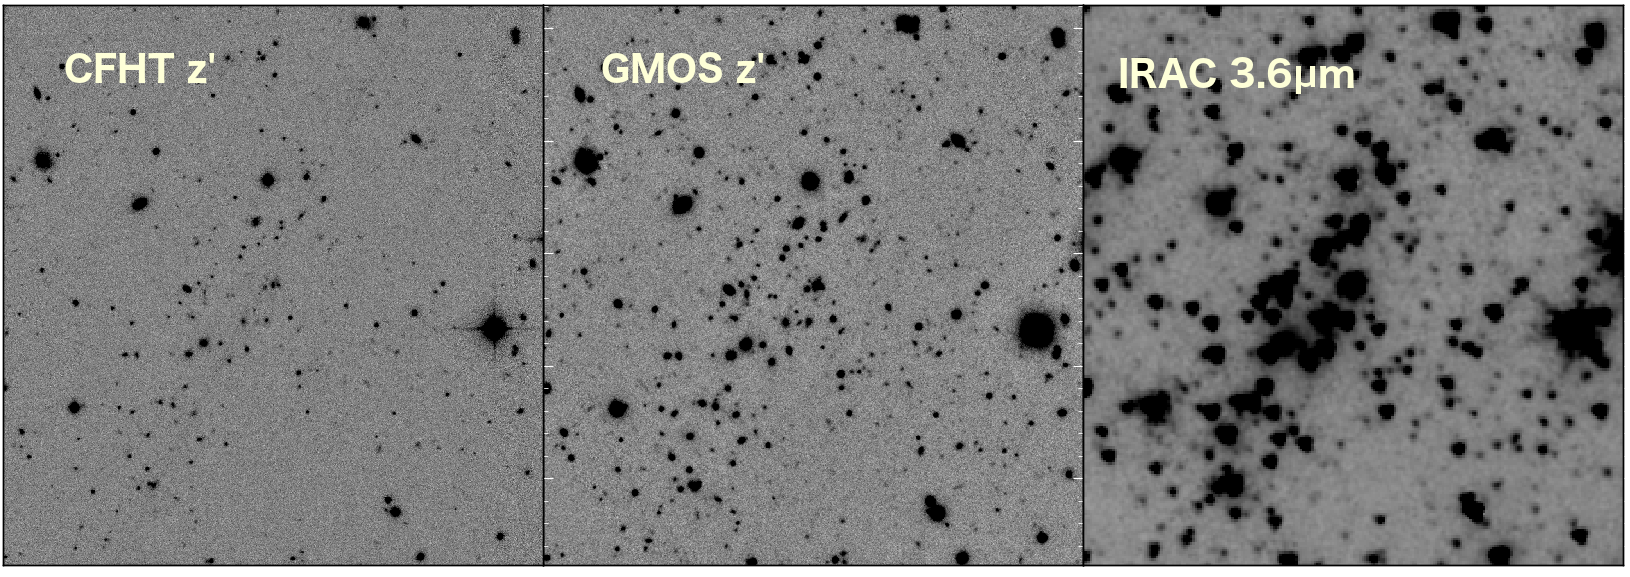 The distant galaxy clusters that we are targeting stand out remarkably in the near-infrared. Here we show our new GMOS z-band image in the centre, compared with the previous shallow image from CFHT. On the right we show an infrared image from the Spitzer space telescope. The galaxy cluster (SpARCS1634) is clearly identifiable as an overdensity of red galaxies in an elongated structure across the image.
With up to 15 hours of total integration time on the faintest galaxies, the spectra allow us to measure the dynamics of different galaxy populations, their stellar populations, and to obtain a robust measurement of the abundance of low-mass, quiescent galaxies. By combining GOGREEN with our existing data on the lower-redshift descendants of these clusters, we will measure the evolution of satellite galaxy dynamics and stellar populations over the last 9.3-Gyr of cosmic time. This will provide new leverage to theoretical models, importantly testing them at an epoch where there are currently almost no constraints.
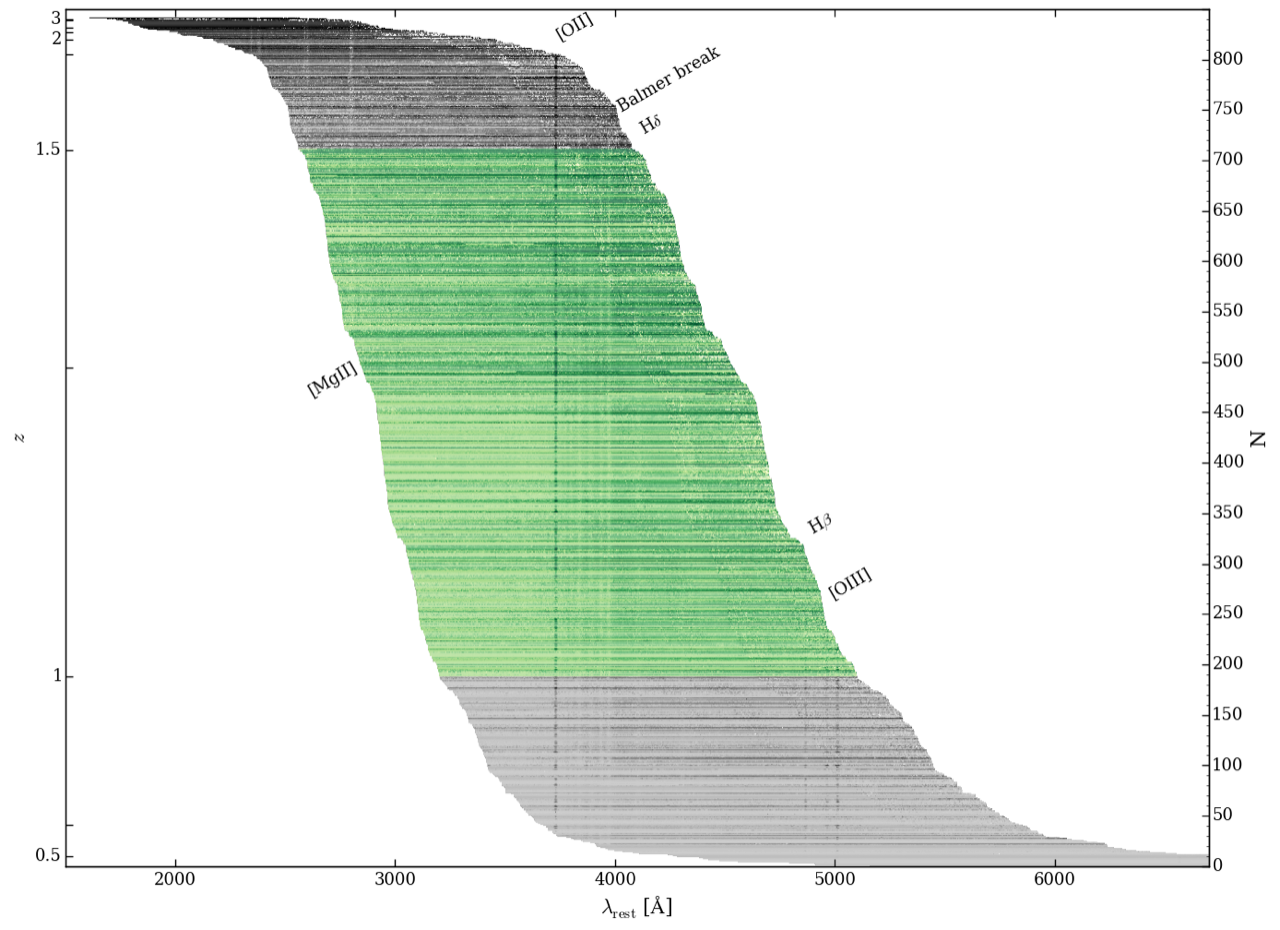 All the GOGREEN spectra with good redshifts to date are shown here, as a function of rest frame wavelength and sorted in order of redshift. The area shaded in green is the 1<z<1.5 redshift range that is our primary target for GOGREEN.
 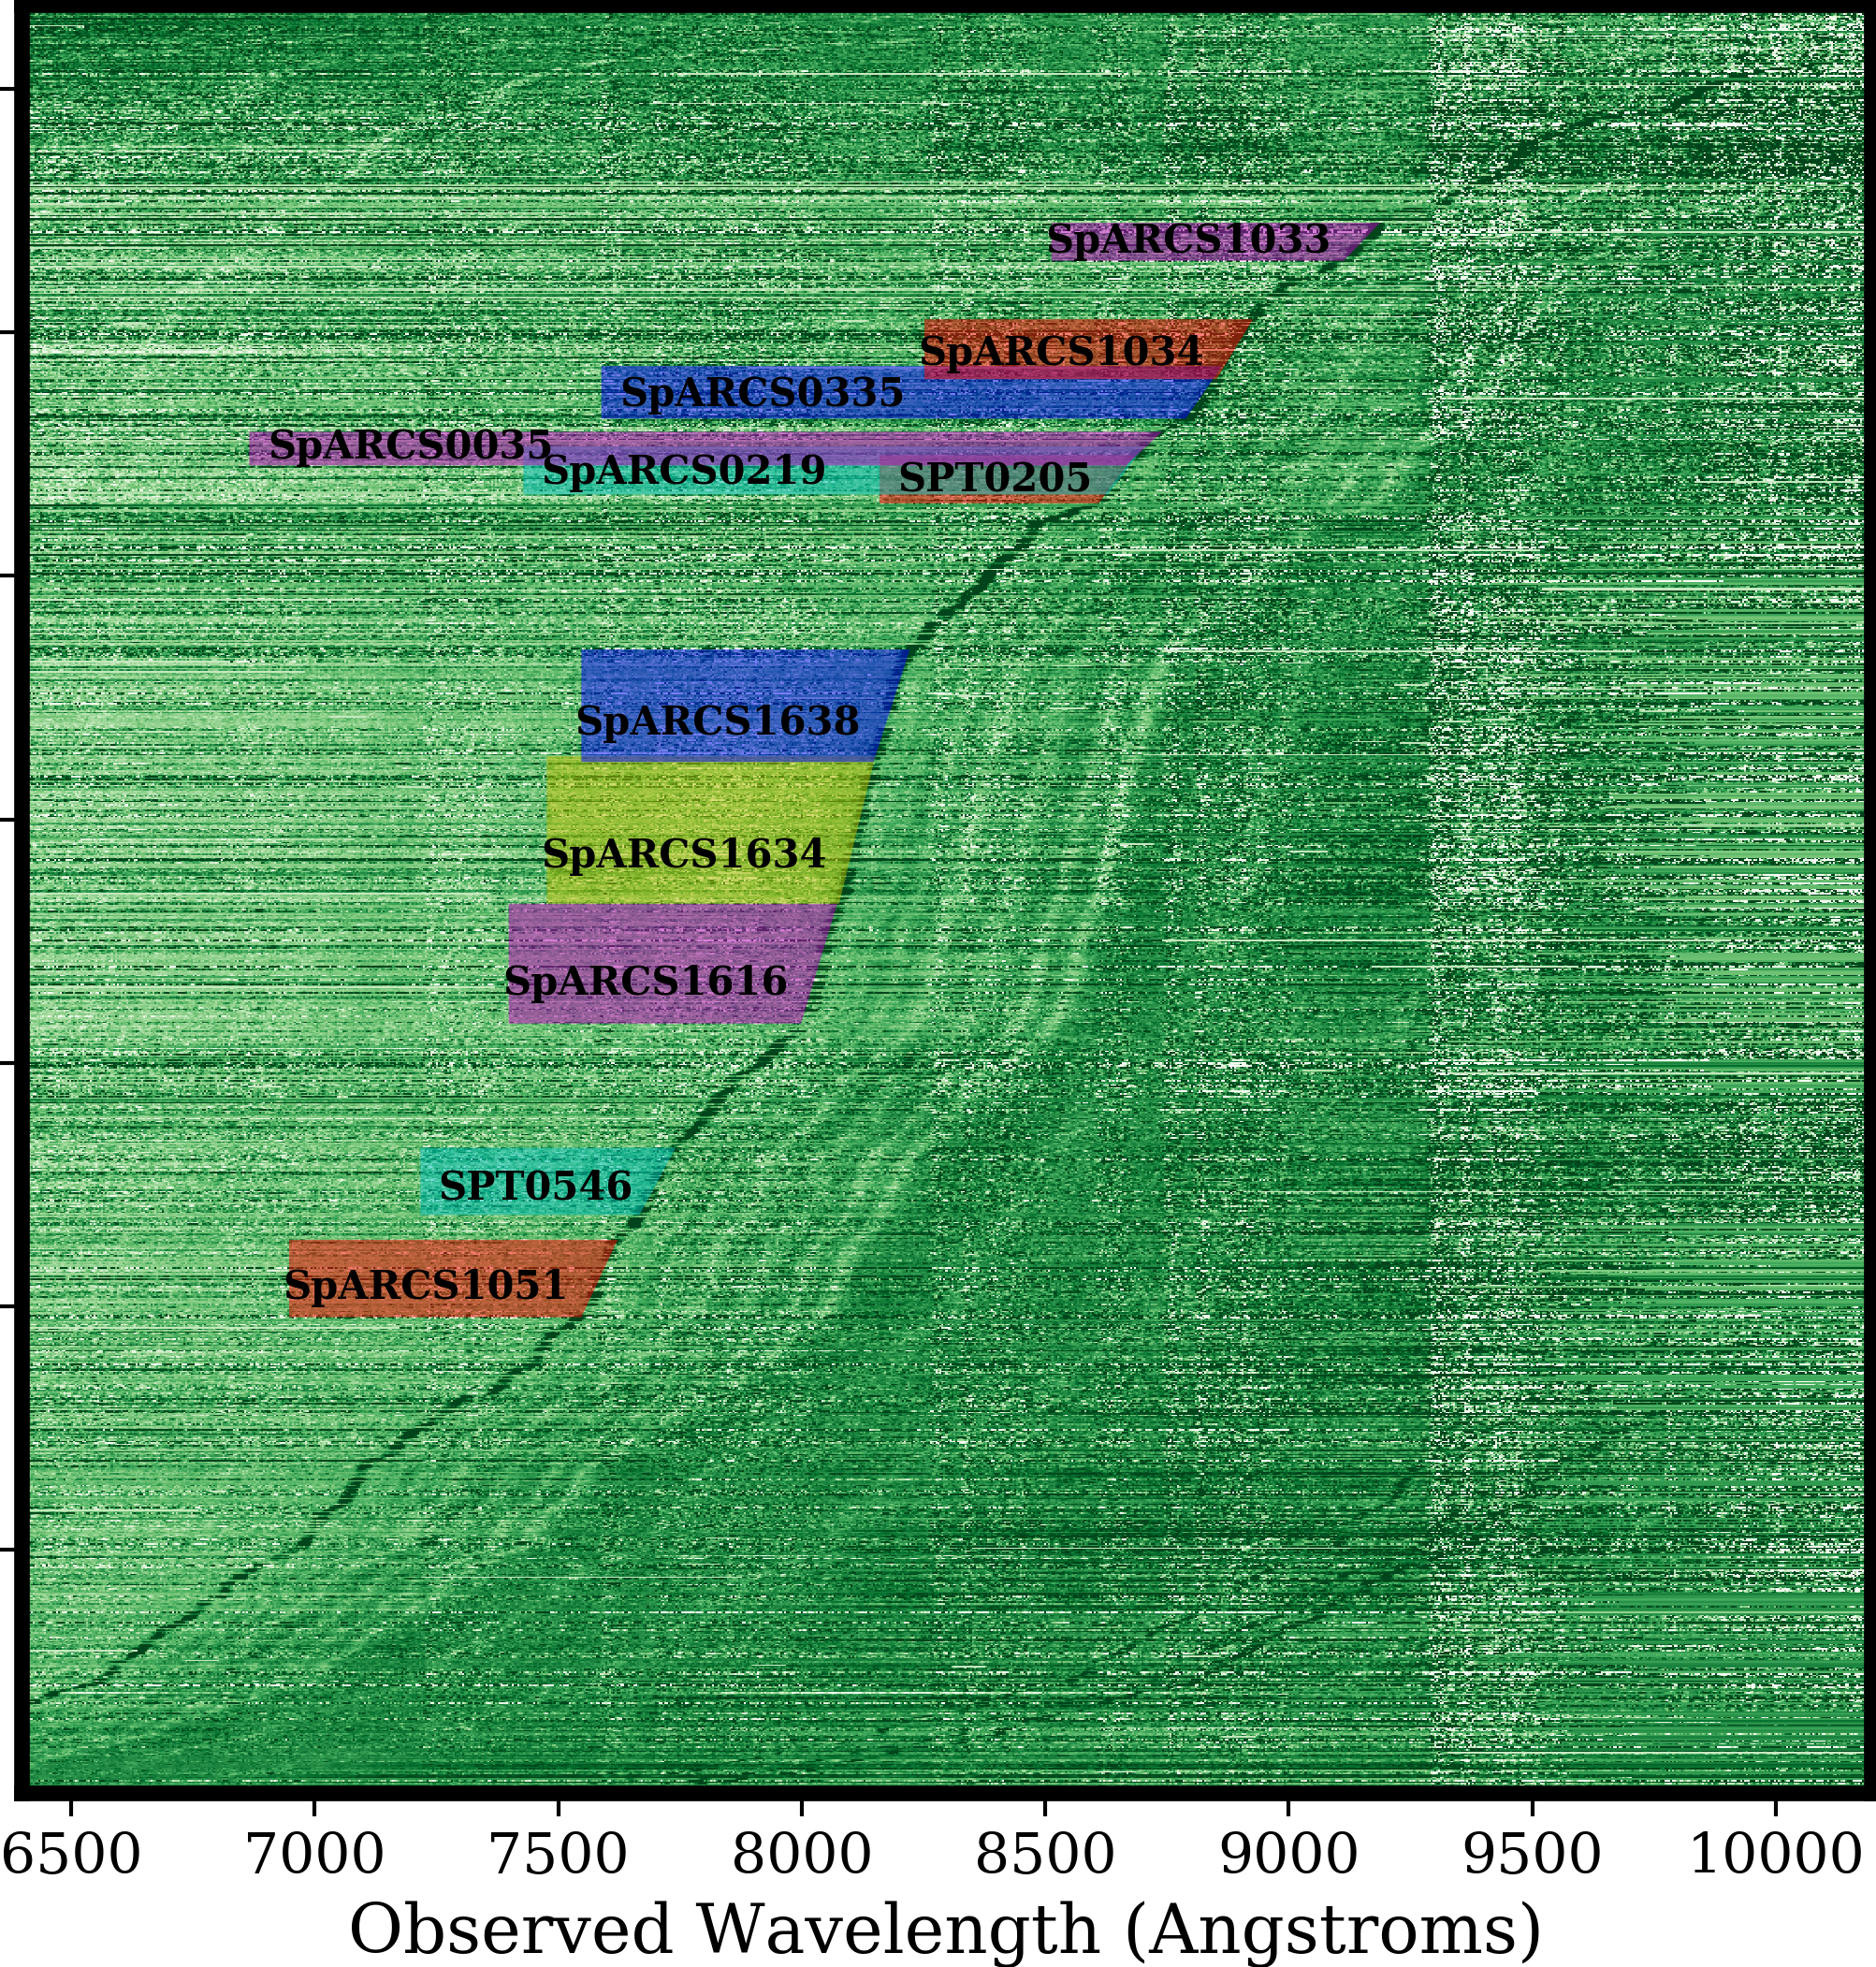 Here we show all the GOGREEN and GCLASS spectra together, as a function of observed frame wavelength. Galaxy clusters are now easily spotted as spectra with similar redshifts, so features line up vertically. These clusters are labelled.
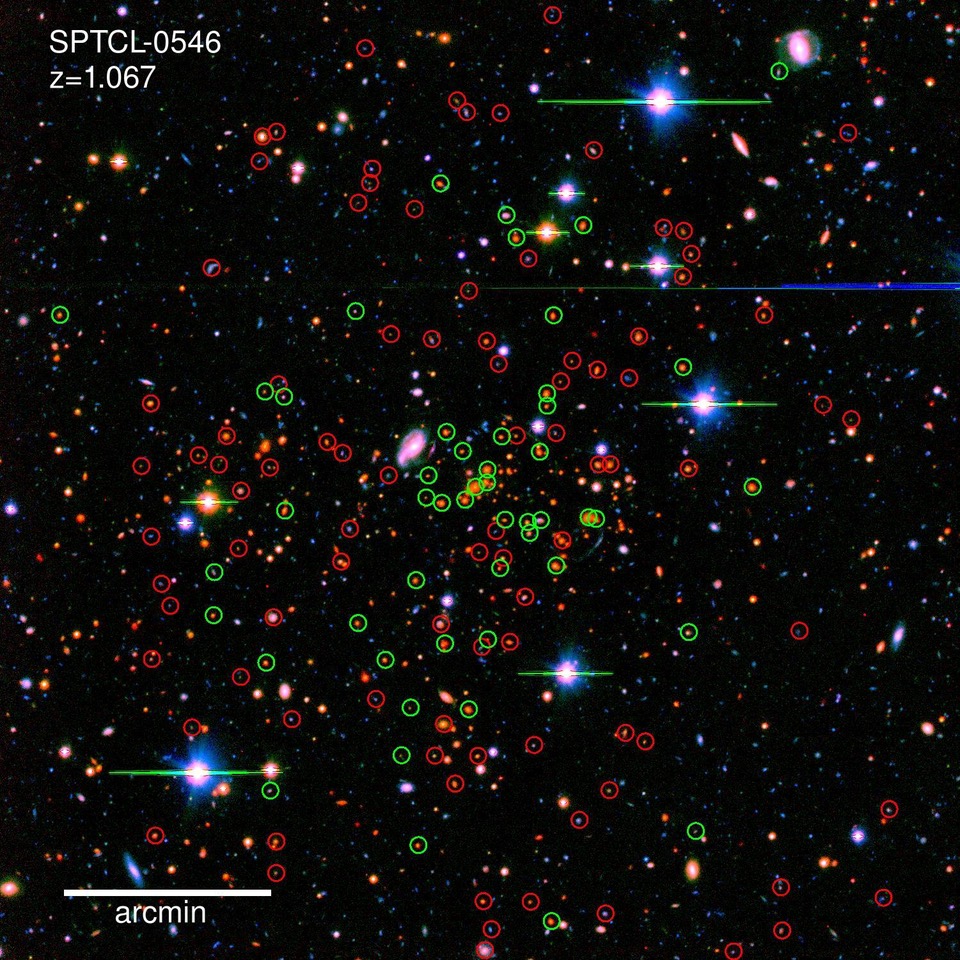
In addition to the spectroscopy we have very deep multicolour optical and IR imaging of all fields. This shows a colour image (B, I and Ks) in which galaxies with spectroscopic redshifts are circled. Green circles indicate cluster members.