All spectroscopic observations for GOGREEN were completed in August 2019. Nearly 100% of the time originally allocated to this Gemini LLP were executed over the five year period 2014-2019.
In addition, the deep, multiwavelength imaging campaign is nearly complete. We are still missing K-band imaging for SpARCS1033; time has been allocated at CFHT for semester 2020B.
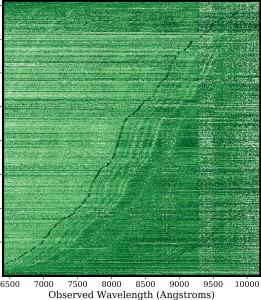 All GOGREEN spectra with good redshifts are shown sorted from lowest (bottom) to highest (top) redshift. The most prominent feature, in black, is the [OII] emission line. But the Balmer series of absorption lines and, at higher redshift, MgII absorption lines, stand out as well. The vertical “bands”, most noticeable on the right, are residuals due to bright night sky emission lines. This illustrates the challenge of working at such red wavelengths, where the sky is bright. All GOGREEN spectra with good redshifts are shown sorted from lowest (bottom) to highest (top) redshift. The most prominent feature, in black, is the [OII] emission line. But the Balmer series of absorption lines and, at higher redshift, MgII absorption lines, stand out as well. The vertical “bands”, most noticeable on the right, are residuals due to bright night sky emission lines. This illustrates the challenge of working at such red wavelengths, where the sky is bright. |
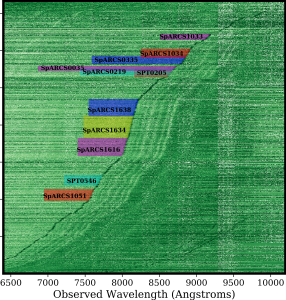 The same plot is shown, with the redshift range corresponding to our target clusters indicated. This version now includes spectra from the GCLASS survey, which targeted brighter galaxies in the lower redshift SpARCS clusters. Since clusters include many galaxies at similar redshift, the spectral features line up close to vertically in these locations. The same plot is shown, with the redshift range corresponding to our target clusters indicated. This version now includes spectra from the GCLASS survey, which targeted brighter galaxies in the lower redshift SpARCS clusters. Since clusters include many galaxies at similar redshift, the spectral features line up close to vertically in these locations. |
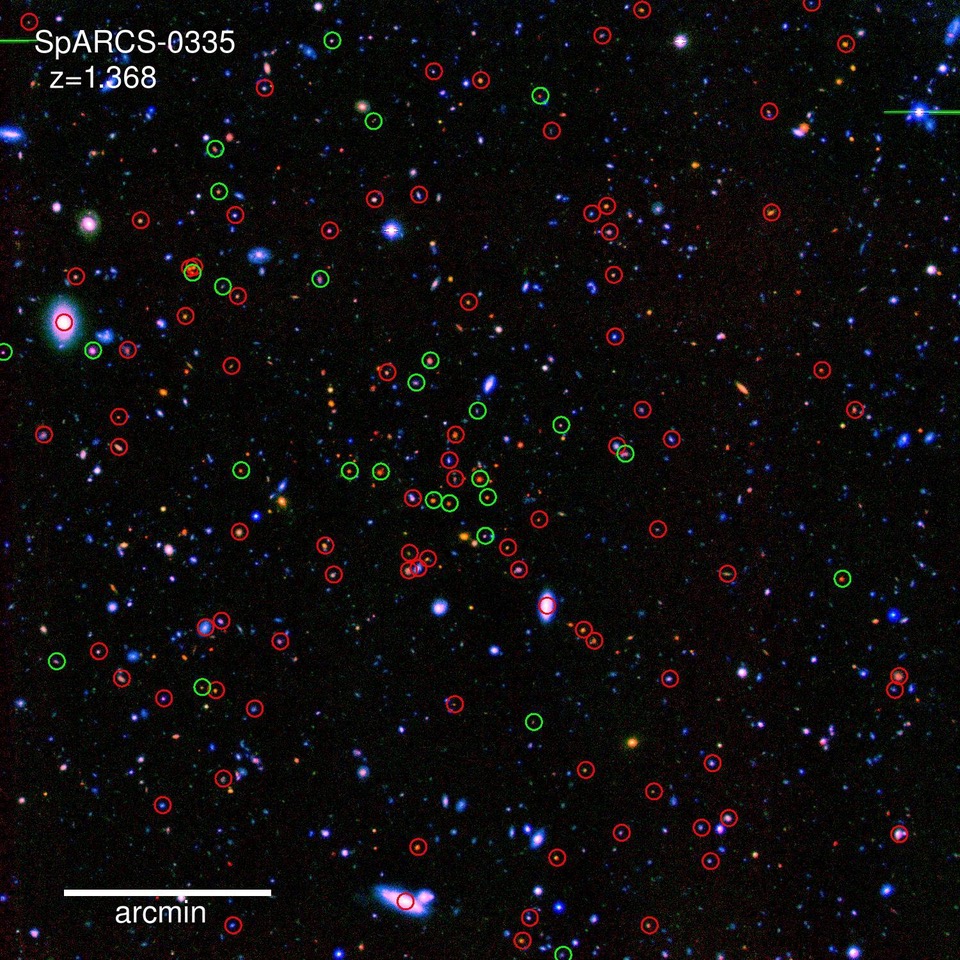
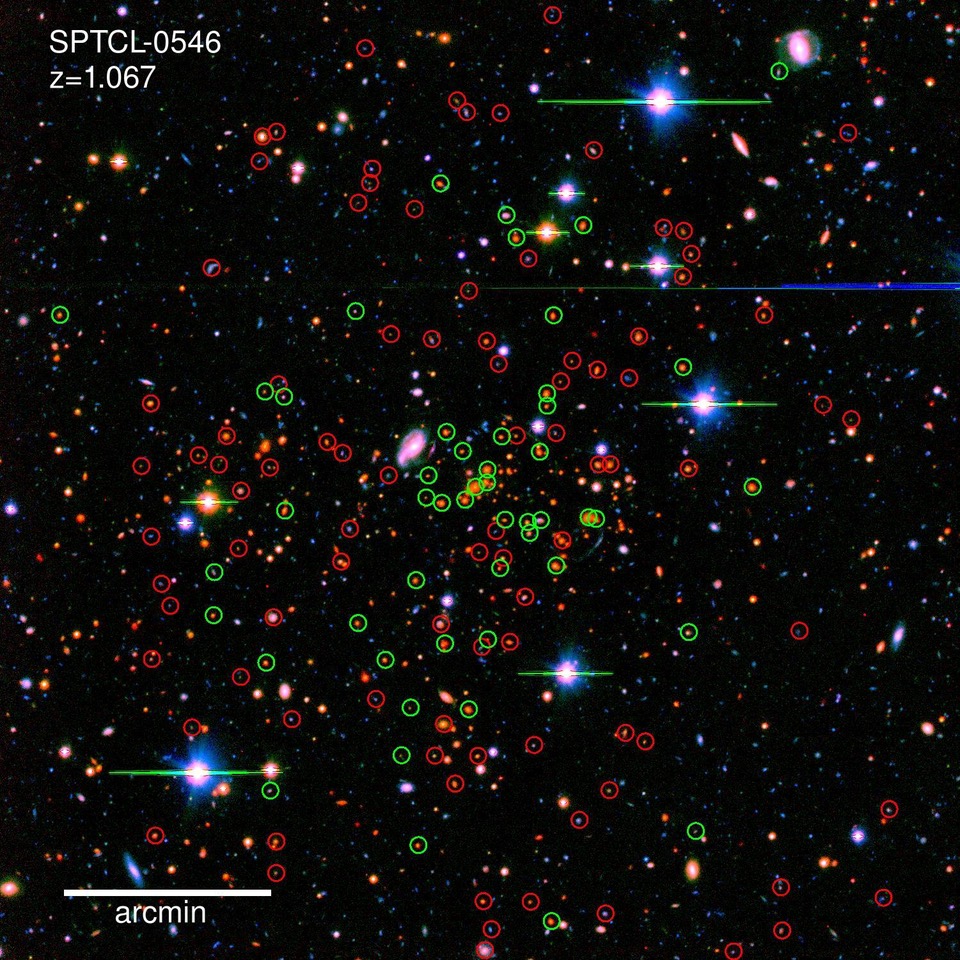
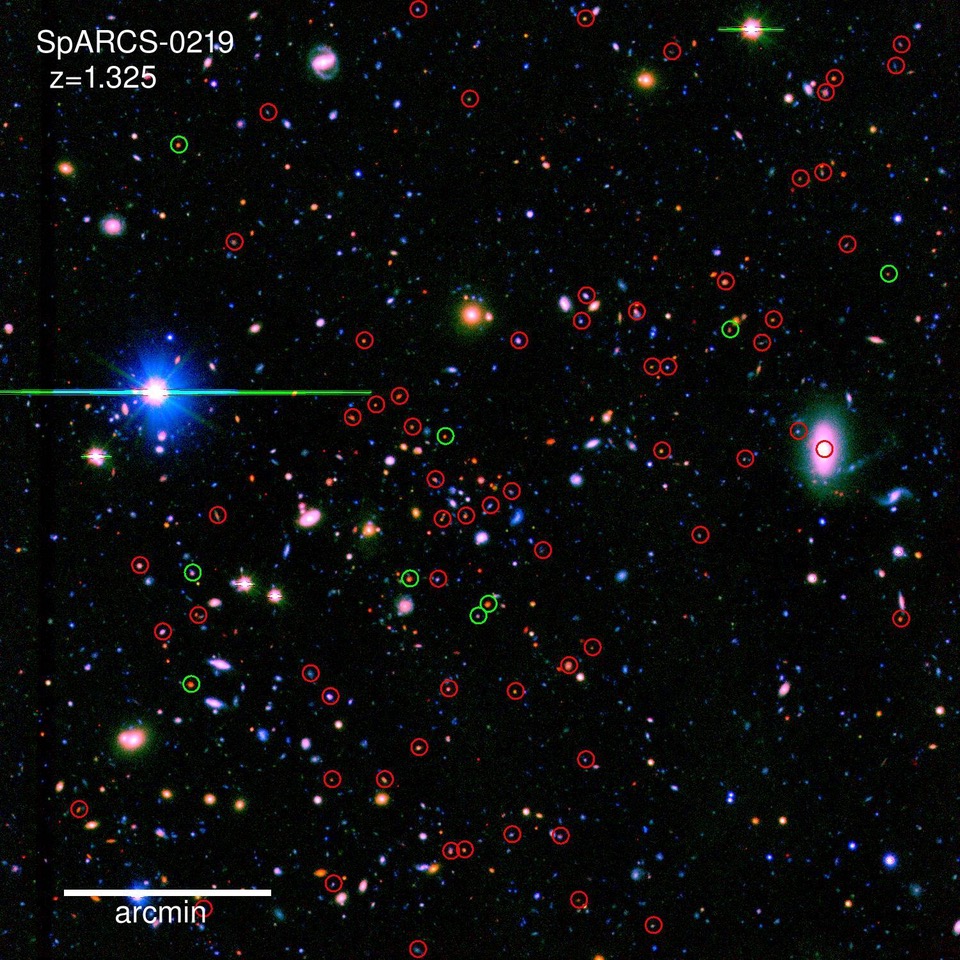
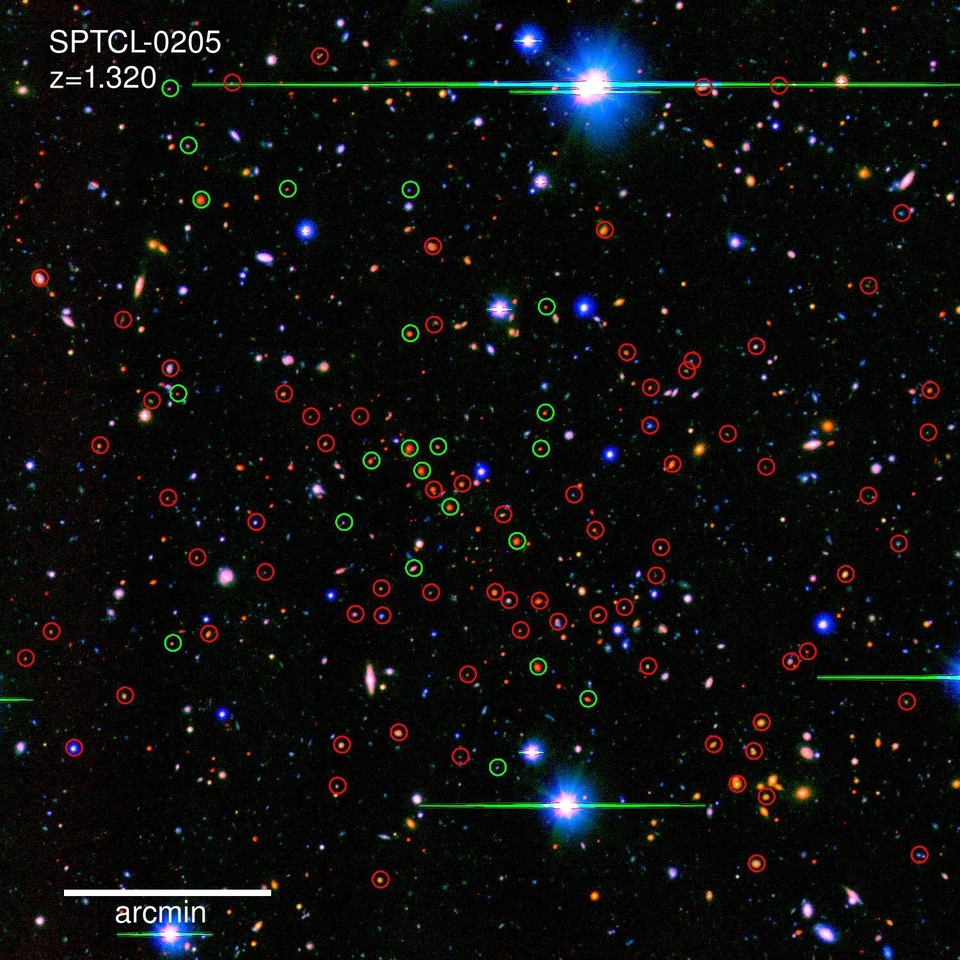
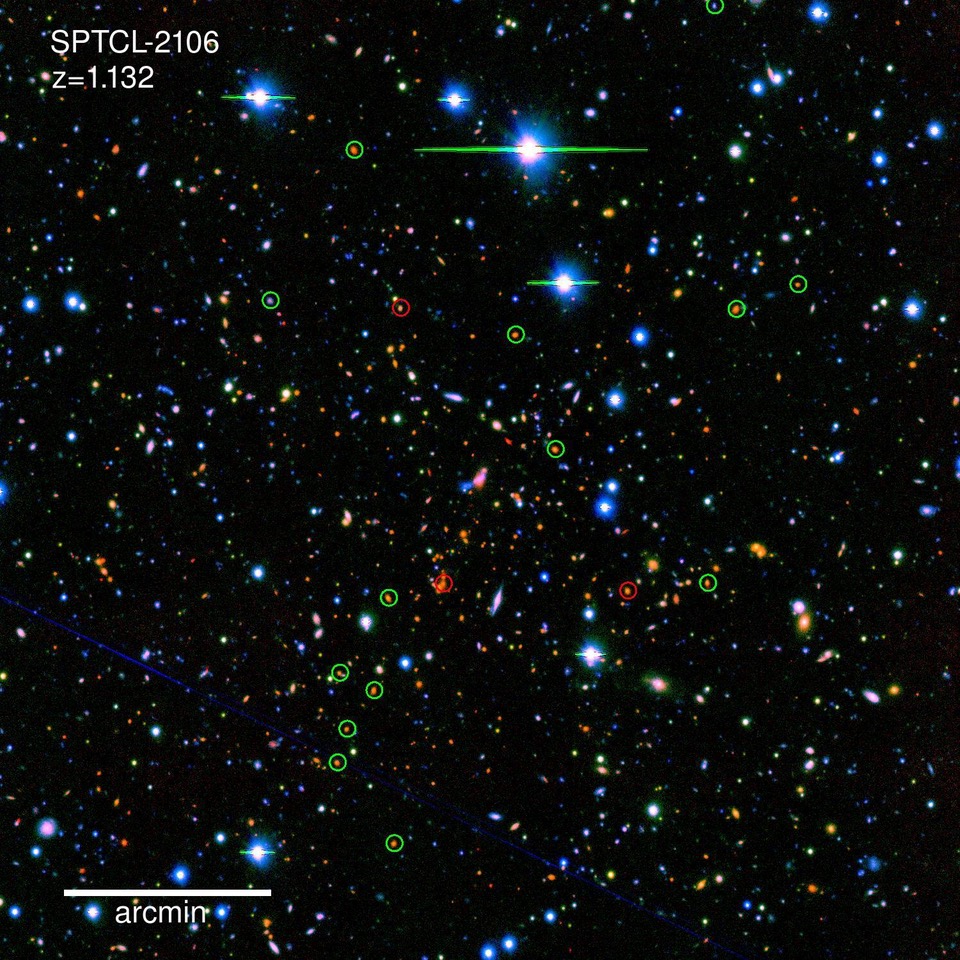
| Images below show three-colour (BIK) images for five southern clusters in the sample. Galaxies with secure spectroscopic redshifts are circled; cluster members are in green. All GOGREEN systems will have deep multiwavelength coverage over the optical and infrared, from which good photometric redshifts are being obtained for all galaxies. |
 |
 |
 |
 |
 |


