
Extending the GCLASS and GEEC2 surveys to lower stellar masses and higher redshifts means taking advantage of the increased red sensitivity of GMOS. Completing the survey with the EEV detectors already installed on Gemini would take more than five times longer – over 2300 hours. With the new upgrade, GOGREEN gains a factor of 5 in depth; the field of view covers 2.6×2.6-Mpc and thus includes the full cluster out to the expected virial radius.
By optimizing the use of nod-and-shuffle technology and the amount of masks assigned to each system, it is possible to obtain spectroscopy in even the densest of cluster cores. The faintest of galaxies were assigned to every mask over the course of several semesters in order to obtain up to 15 hours of total exposure time. Massive clusters which have little or no existing data will take 5 masks of 3 hours each, to maximize the number of brighter targets. Oppositely, clusters with existing spectroscopy will take three masks of 5 hour exposures, as there are fewer bright targets available. The masks are spread over three semesters, to make adjustments between observations (e.g., replacing faint targets that have reached the desired S/N – signal to noise ratio – prematurely).
Instrument Setup
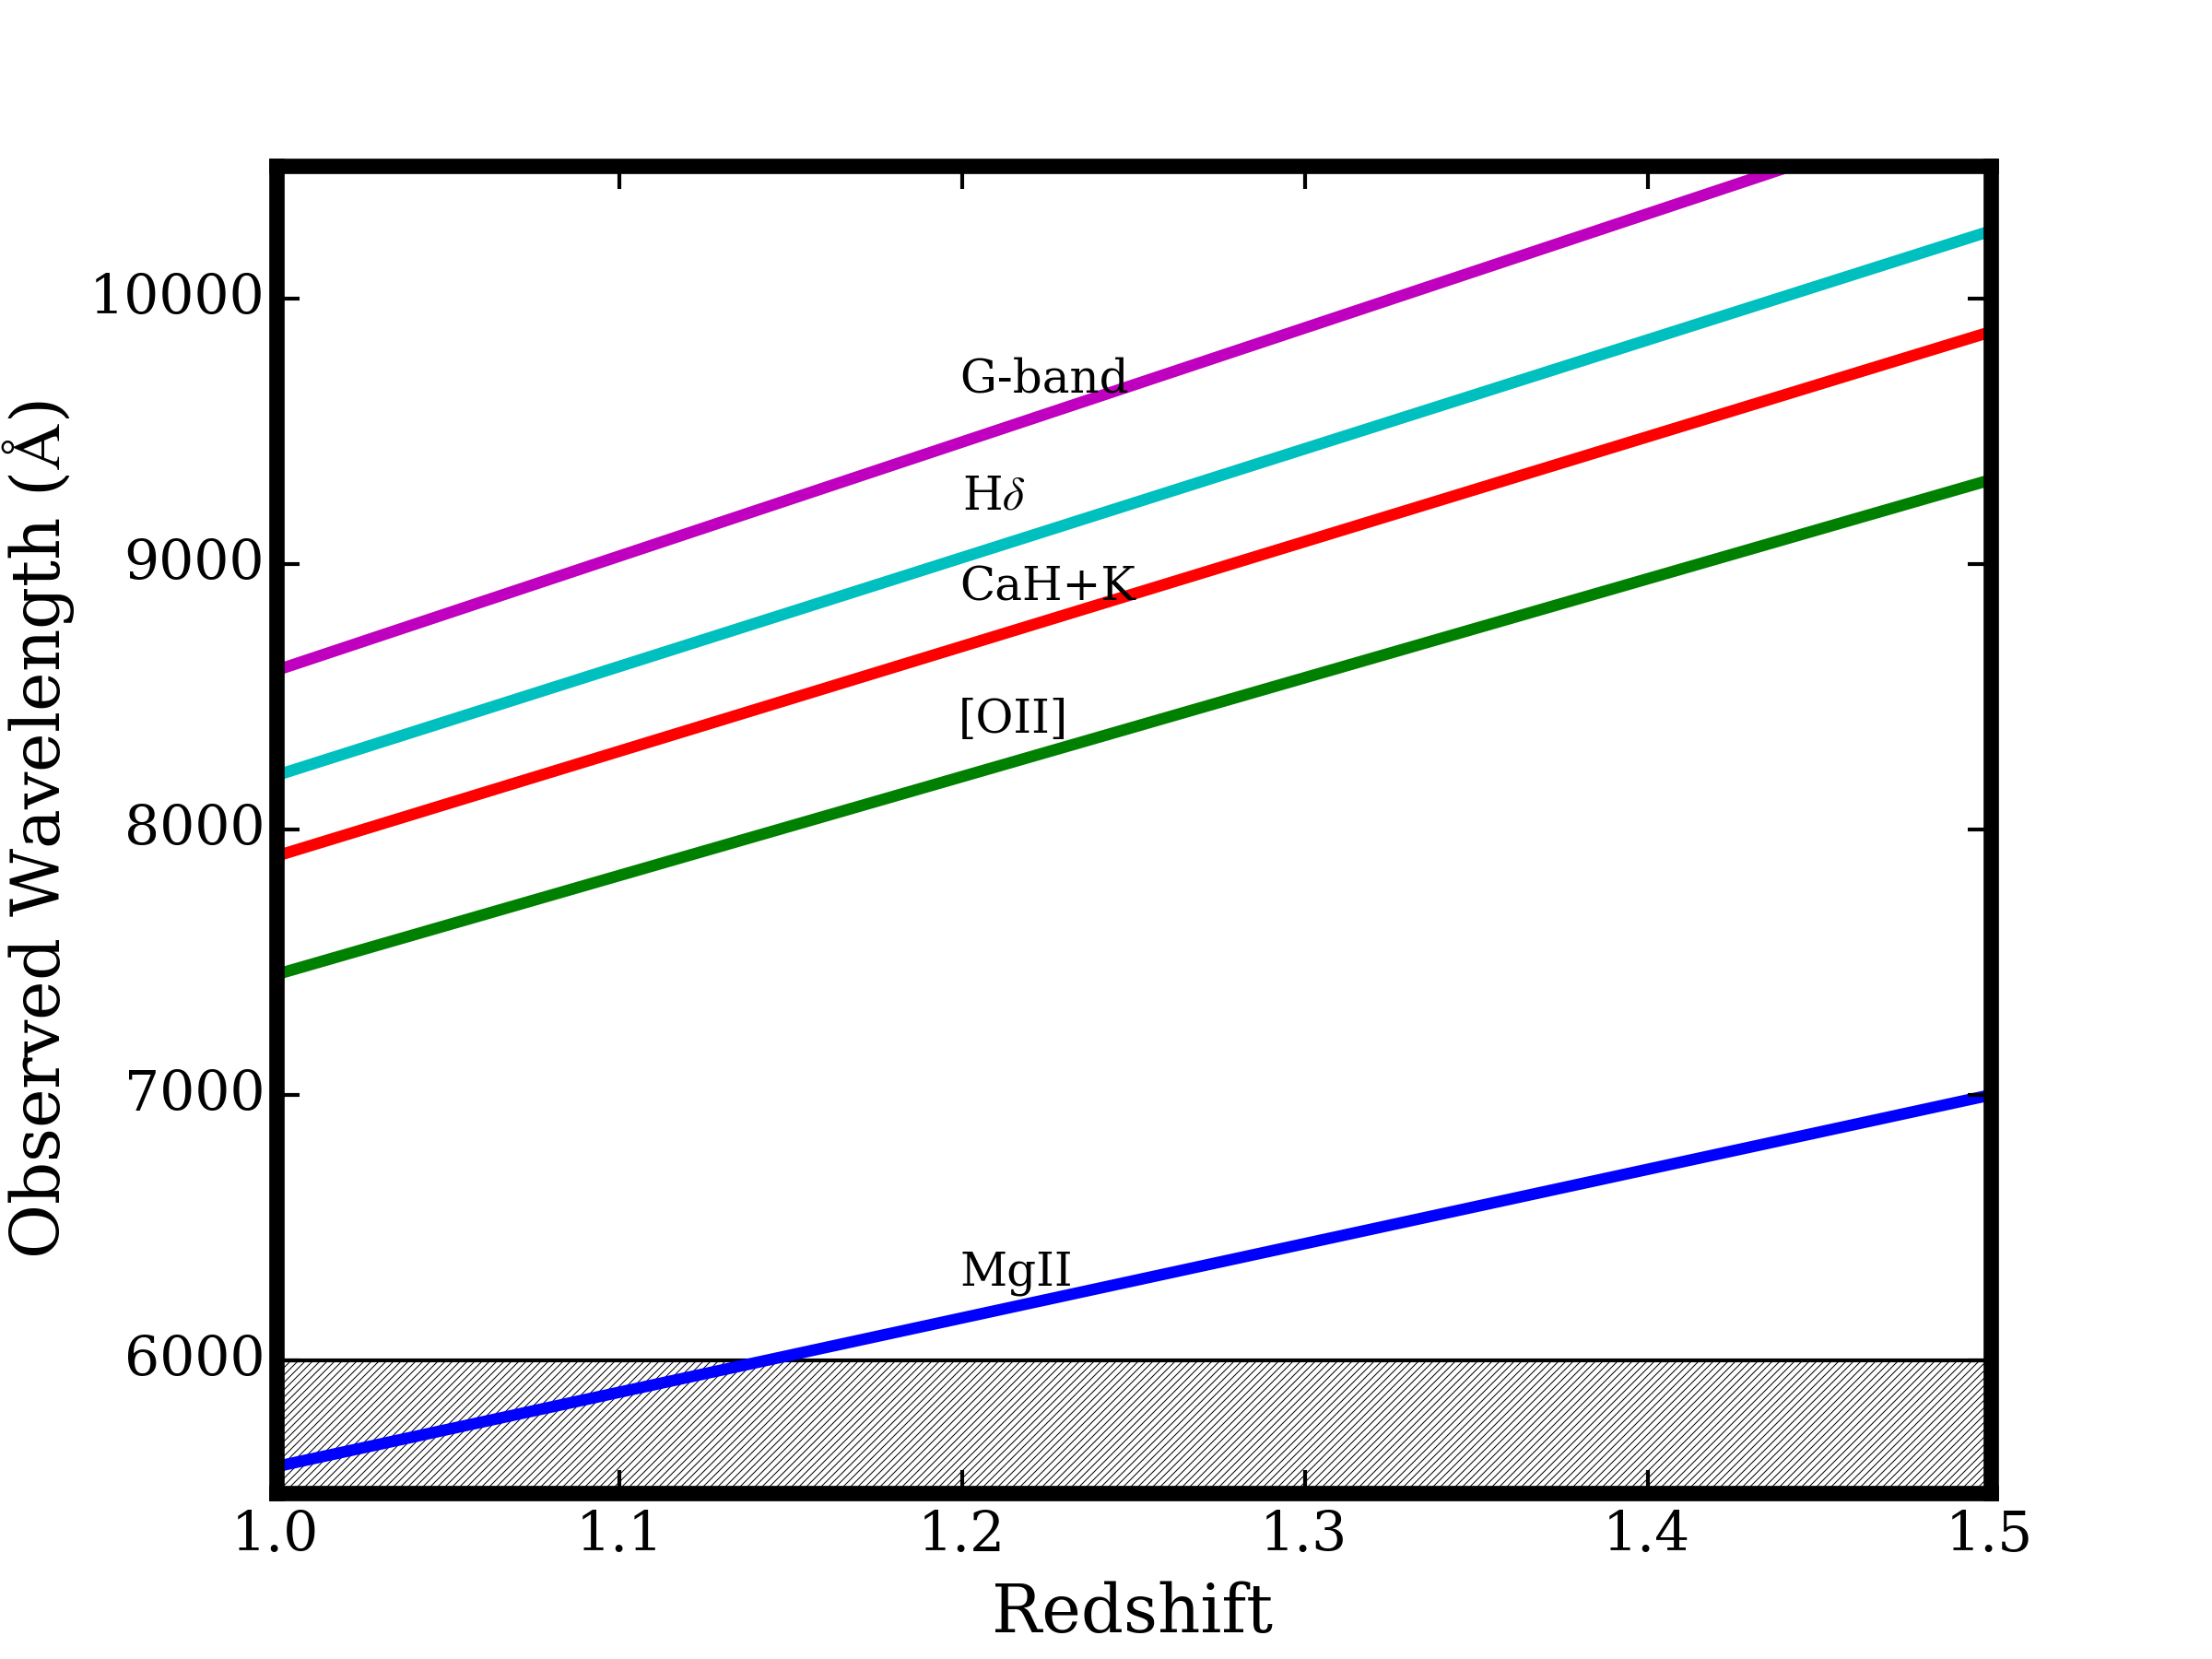
The coverage of key spectral features is shown as a function of redshift, over the target redshift range z=1.0-1.5. While good data are obtained over the full wavelength range 550-1020 nm, the wavelength calibration is unreliable below 600nm, indicated as the shaded region. With the good red sensitivity and accurate sky subtraction, we are able to identify the usual UV and optical line indices over the full redshift range.
Target selection
Galaxies in the cluster sample were selected based on their 3.6-µm flux (from Spitzer-IRAC), and their z−band flux (from deep GMOS imaging). For the less-rich groups, we select targets from their photometric redshifts, taking advantage of existing data.
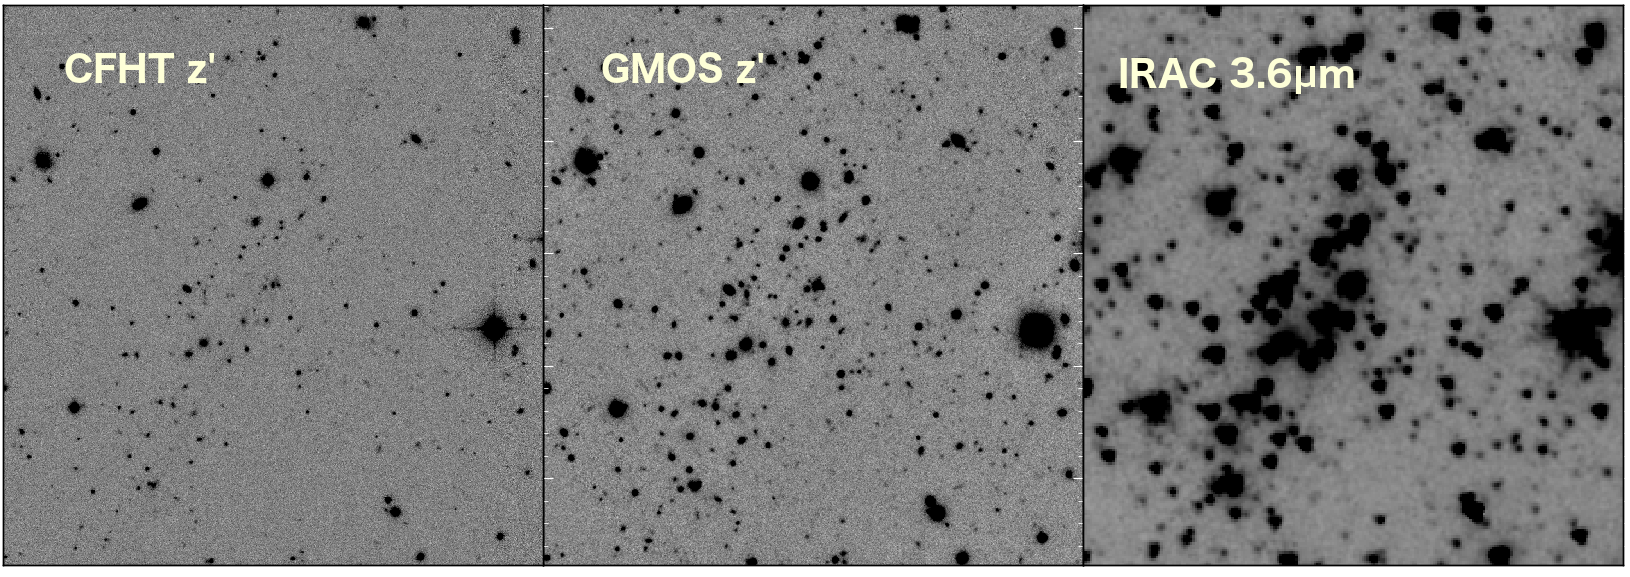
An example of our target selection imaging is shown here, for SpARCS1634. The left image shows the central 2.4′ of the original SpARCS imaging available from CFHT MegaCam, from which the clusters were detected. In the middle panel we present our new z’ image from GMOS, and on the right we show the deep IRAC image. all images are oriented with North up and East to the left.
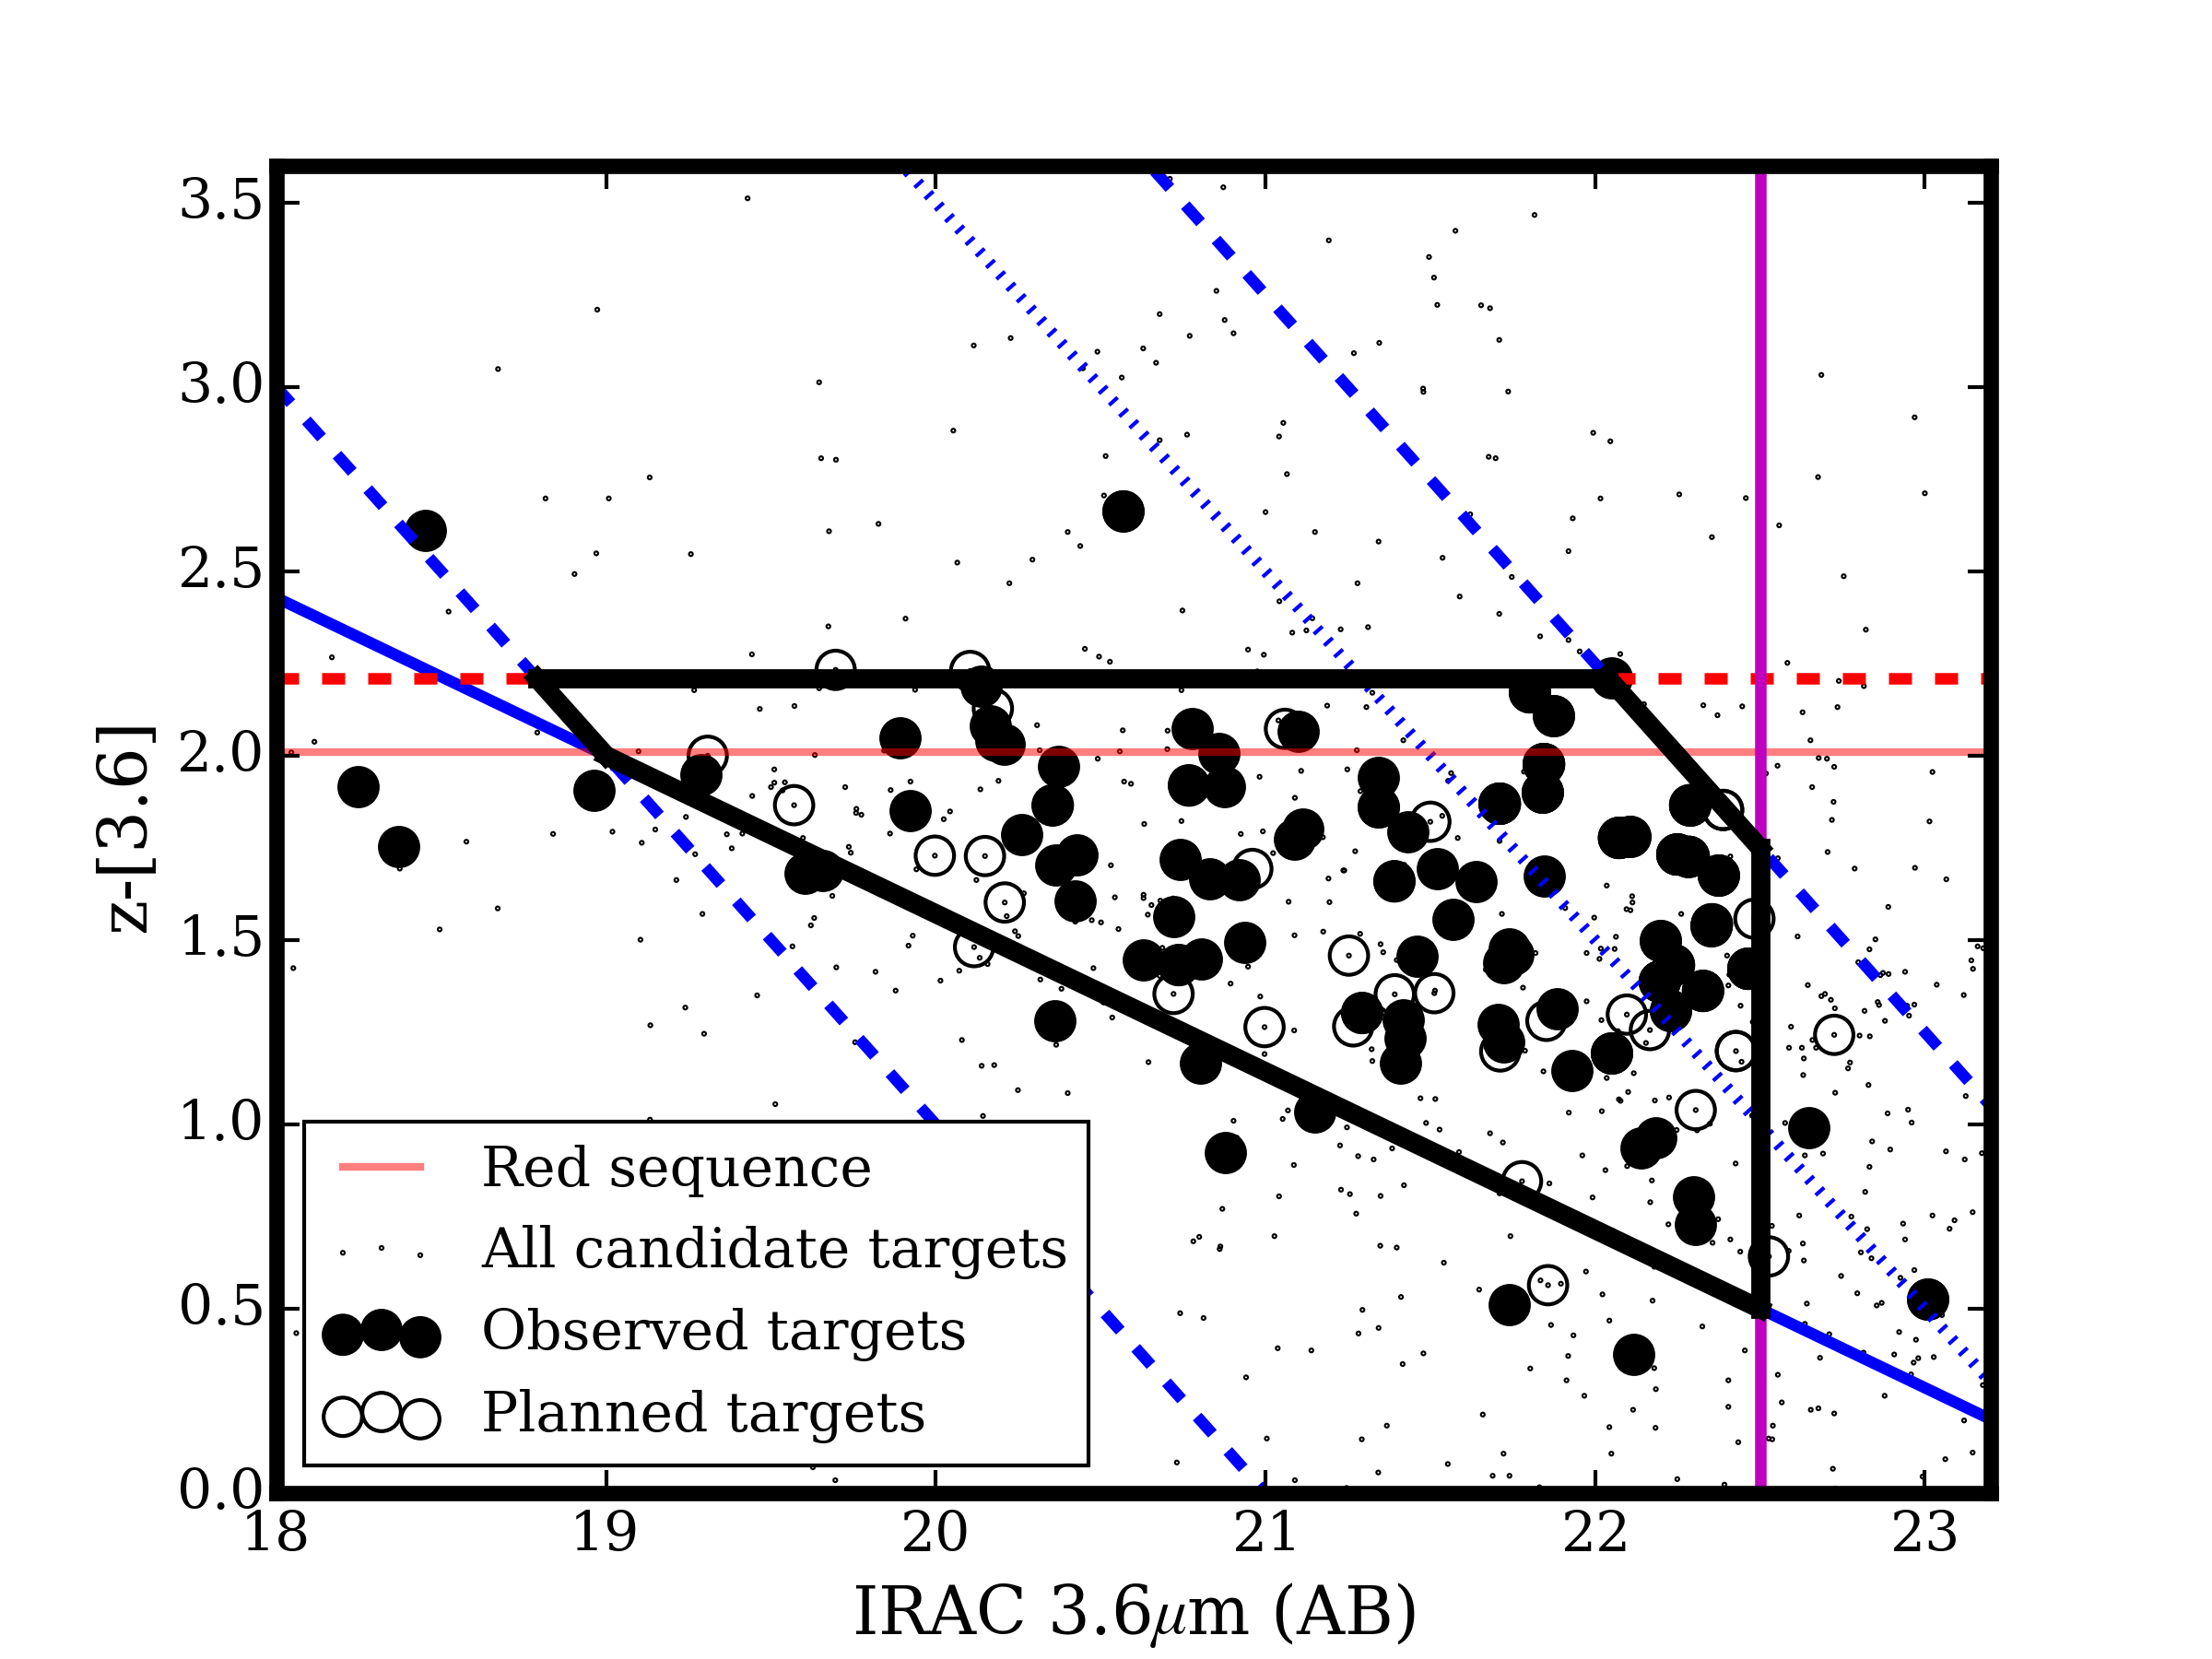 The colour-magnitude diagram of SPT0546 is shown here, with all galaxies detected in z’ and IRAC within the GMOS field of view shown as small dots. The thick black lines outline the selection area for our primary target sample. This is bounded by the IRAC limit of 22.5 (solid, vertical magenta line), the z’=21-24.5 limits (thick, blue dashed lines), a colour cut to exclude foreground galaxies (thick blue solid line) and a cut 0.2 mag brighter than the red sequence (dashed red line, with the red sequence itself shown as the solid, red line). The dotted blue line indicates z’=23.5; primary targets fainter than this are observed on multiple masks to increase exposure time. Six masks were designed for this cluster, and four have been observed. Large, filled points indicate galaxies already observed, while large open symbols are those allocated to masks that have not yet been observed. Some targets that lie outside the colour selection boundaries are included in the masks as “fillers”, once the mask is fully populated with priority targets.
Sample Data
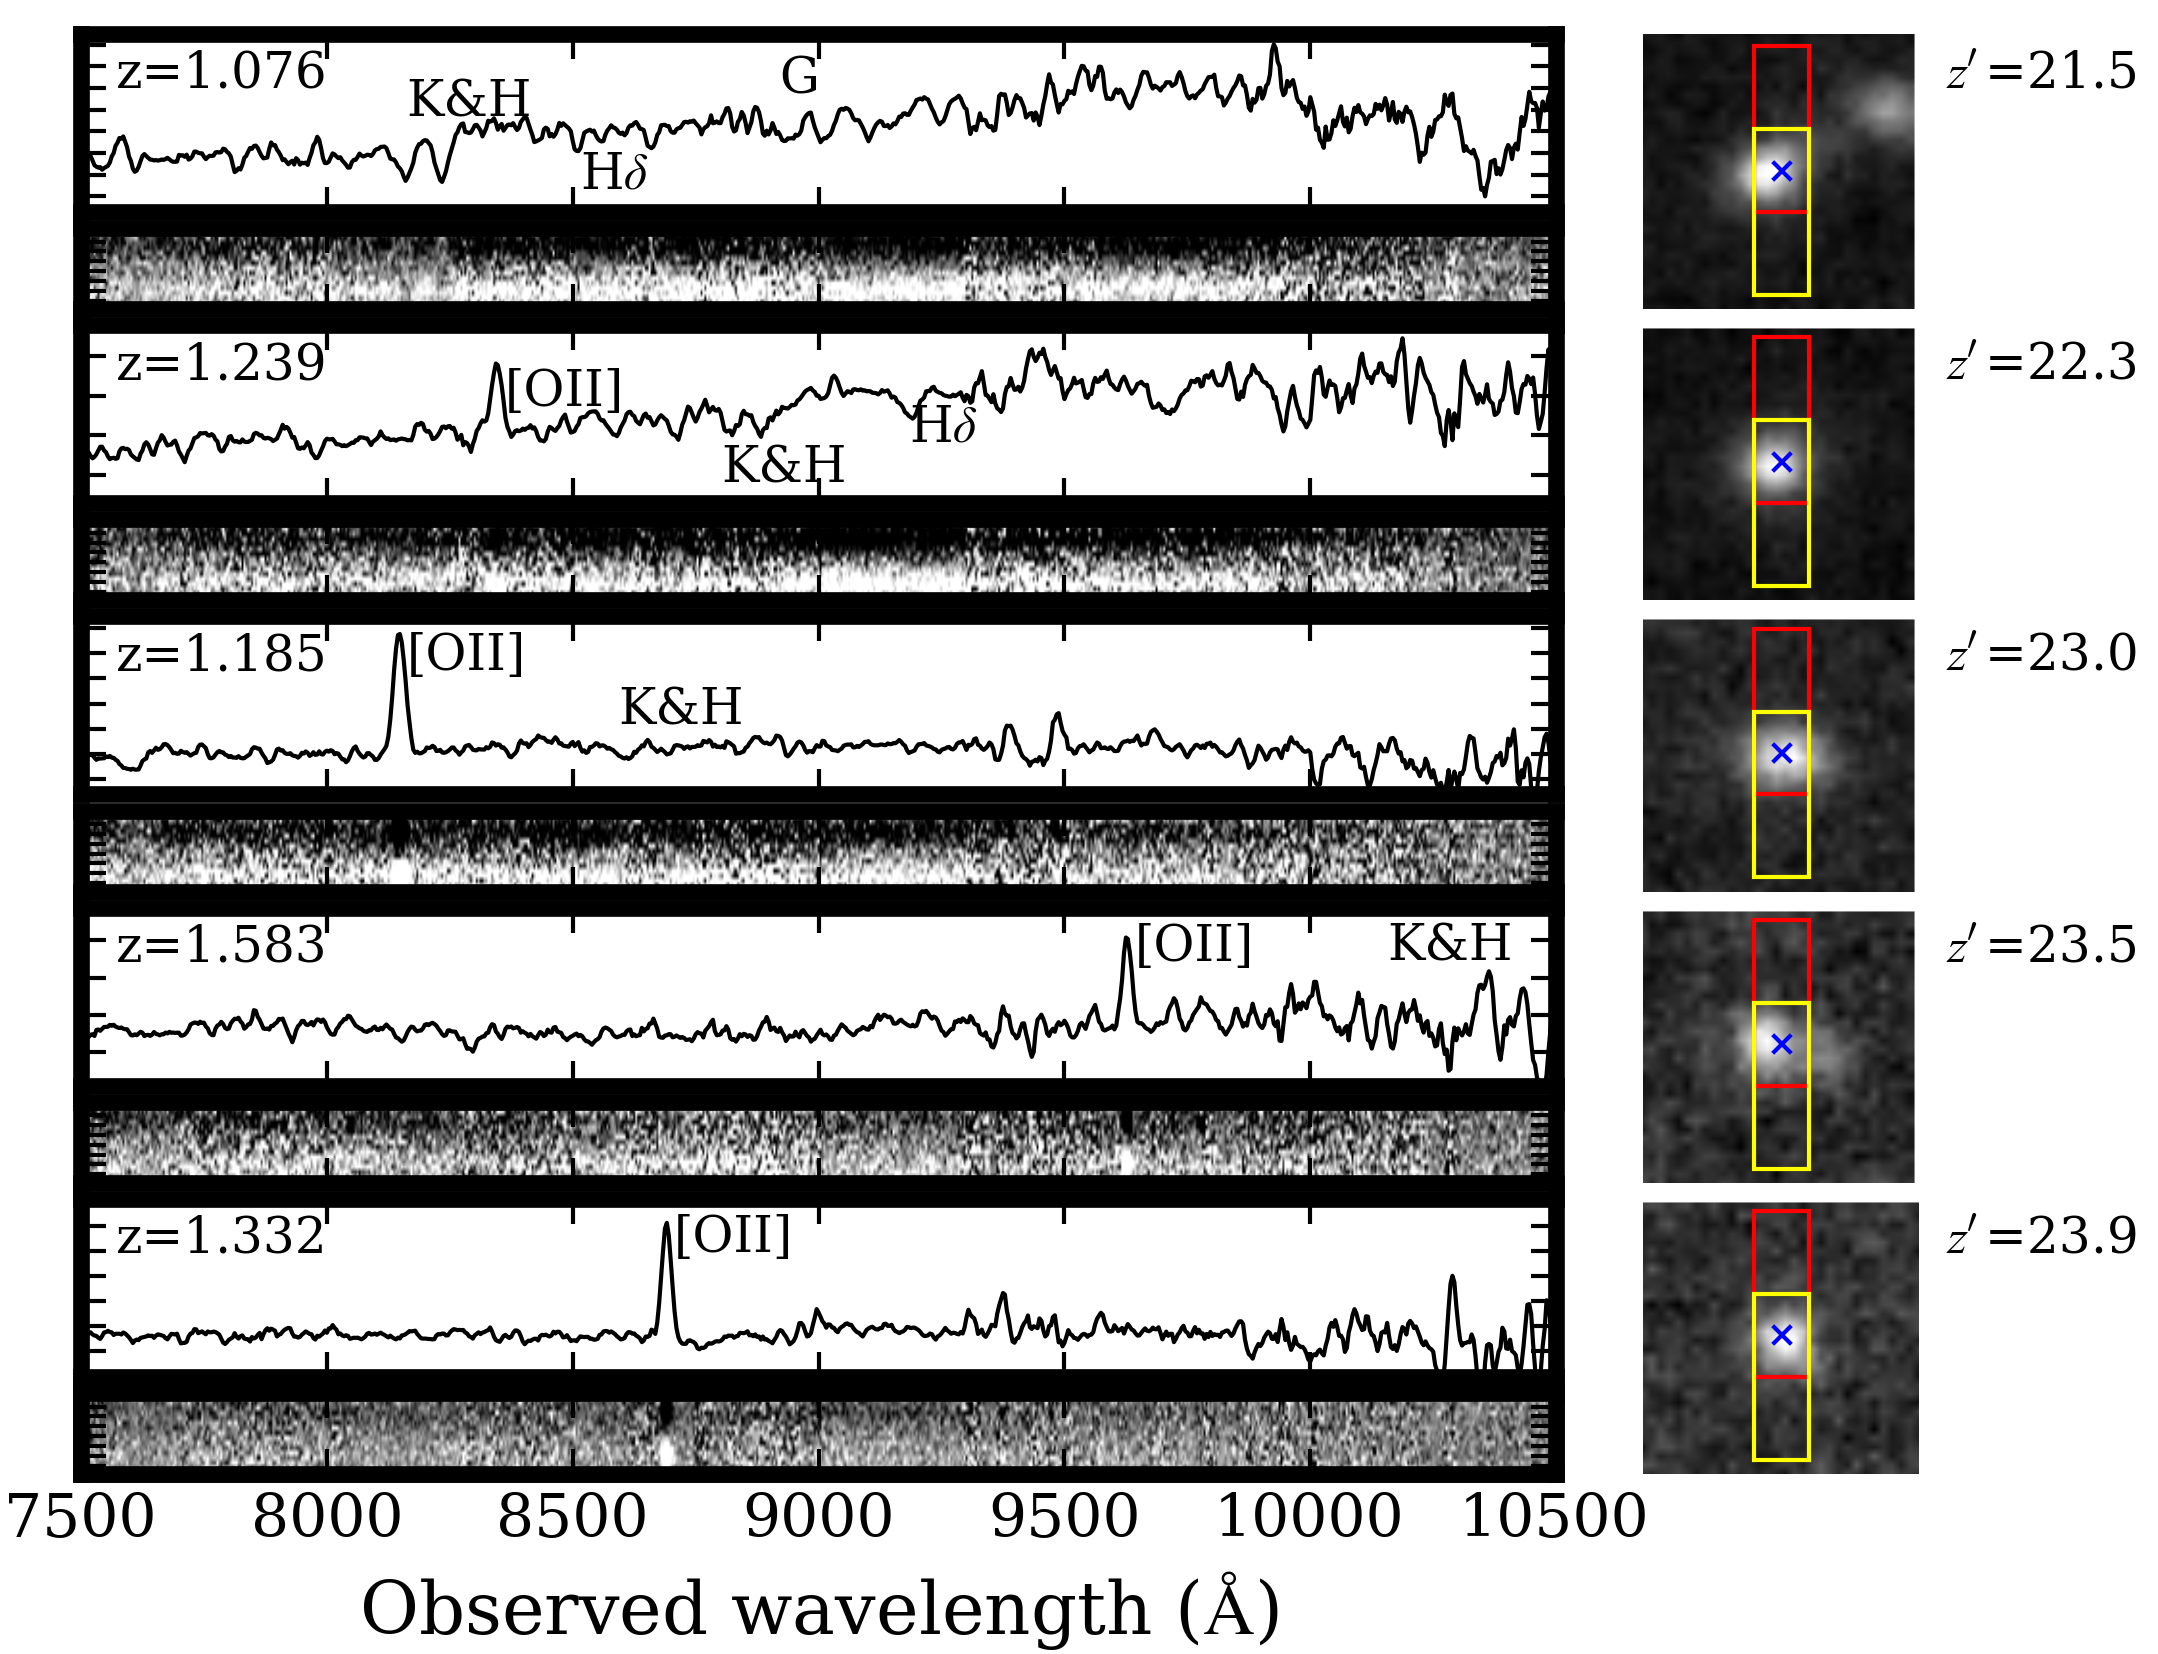 Sample data are shown for five galaxies in a range of z’ magnitudes, indicated by the numbers on the right. Redshifts are given in the top left corner of each panel, and key identifiable spectral features are labelled (Calcium H and K, Hδ and G-band absorption, and [OII] emission). The stamps on the right show the z’-band image, scaled to the minimum and maximum counts within the subimage. The red and yellow rectangles show the predicted slit position in both nod positions. To the left are the 1D (top) and 2D (bottom) reduced spectra, after all reduction including sky subtraction, charge diffusion correction, and telluric/sensitivity correction (the latter applied only to the 1D spectrum). All spectra shown here are from 7.2ks of exposure, and the 1D spectra are convolved with a 5 pixel (~2nm) boxcar filter. For the faintest two galaxies, the goal is to build up the signal-to-noise by reobserving in multiple masks, with up to 54ks exposure by the end of the survey.